Originally published by: Get Elastic Ecommerce Blog on 2012-11-16 08:04:16 by Linda Bustos

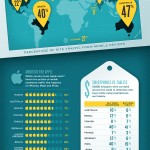
This week’s infographic looks at global trends in mobile commerce for smartphones and tablets. Mobify analyzed 200 million visitors to mobile commerce sites.Click to enlarge infographicNot surprising, China and India lead the charge in use of mobile devices, but I expected Japan and South Korea to be up there.Tweetable stats:Australian mobile traffic to #ecommerce sites (47%) trumps the US + UK (31% each) Tweet this27% of traffic to #ecommerce sites come from mobile devices, global avg Tweet this82% of Russia’s mobile traffic to #ecommerce sites is from Apple devices vs 56% in the US Tweet this*Only* 56% of US mobile traffic to #ecommerce sites comes from Apple devices Tweet this46% of Chinese online shoppers use smartphones to purchase vs 15% in the US, 14% in UK Tweet this41% of Chinese online shoppers use tablets to purchase vs. 9% in US, 6% in UK Tweet thisFrance and Japan have the lowest number of mobile shoppers Tweet thisChina and India have the highest rates of mobile shoppers (smartphones and tablets) Tweet thisTags: infographic
Continued: